Having gotten over the shock of Donald Trump’s election, I found myself wanting to better understand the results in the context of my own community. How conservative is Collier County compared to the state as a whole? Were the results pretty much the same throughout the County, or were there pockets that voted significantly differently?
While our 87 percent voter turnout was the highest in the state (see “Voter turnout in Collier was No. 1 among Florida counties, helping Trump win”), was there a similarly strong participation at all levels of government, or just in the high-stakes, highly-publicized presidential contest?
So I did some digging into the Collier County vote results and additional information I requested from the Supervisor of Elections Office. In this post, I’ll share the highlights of my review, and some thoughts about what I learned.
How conservative is Collier County compared to the state as a whole?
The county has long been so overwhelmingly Republican that in most recent elections, no Democrat could be convinced to run.
This year, admirably, there were two notable exceptions: Democrats Annisa Karim and Tamara Paquette ran for County Commission in Districts 3 and 5, respectively. But their Republican opponents Burt Saunders and Bill McDaniel won, with 66 and 56 percent of the votes, respectively.
Based on the results of the November elections, that strong Republican bias continues. In each of the contests for federal office (Table 1), the Republican candidate won Collier County with at least 60 percent of the votes. And in each case, the win was stronger here than in the state or Congressional district as a whole. In fact, Donald Trump won Florida with less than 50 percent of the vote.
 |
| Table 1 |
For details of Collier’s 2016 General Election results, click here; for Florida’s results, click here.
As of today, 51 percent of Collier registered voters are Republican, 24 percent are Democrat, and the rest are No Party Affiliation or other parties. These figures are updated daily at www.colliervotes.com.
Collier County has been and continues to be solidly Republican and much more conservative than the state as a whole.
Were there pockets of the County that voted differently?
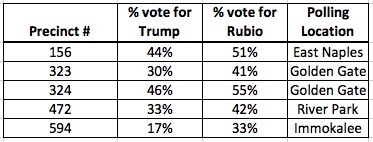
Not only did Republicans carry the County, they carried all but five of the 60 precincts (Table 2). It is not surprising that precincts located in East Naples, Golden Gate, River Park and Immokalee went for Clinton, as they are some of the lowest income areas of the county. But interestingly, Rubio carried two of the five: precincts 156 in East Naples and 324 in Golden Gate.
 |
| Table 2 |
I was disappointed, though not surprised, to learn that the precinct I live in went slightly more heavily for Trump and Rubio than the County as a whole. For County results by precinct, including how the precinct you live in voted, click here.
While there are a few pockets of the County in which a majority voted differently, for the most part, the County voted Republican.
Did the strong voter turnout carry to the down-ballot races?
When a voter casts a ballot but doesn’t register a vote in one of the races on it, it registers as an “under vote.” I was again disappointed, but not surprised, to learn that Collier’s record high voter turnout did not mean a similar degree of voter participation in the less-well-known and publicized races.
 |
| Table 3 |
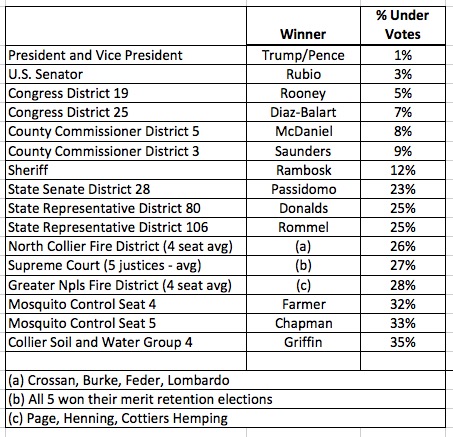
Table 3 shows that, as would be expected, the smallest percent of under votes was registered in the presidential election. Just one percent of the Collier voters who cast a ballot chose not vote for any of the presidential candidates. Ninety-nine percent did.
However moving down the ballot, the number of people who left votes blank increased. Three percent didn’t vote in the U.S. Senate race. Five percent didn’t vote in the Congressional District 19 race.
The under vote was significantly higher, meaning a significantly smaller percentage of people voted, in the State House or Senate races than in the County Commission races. For example, the under vote in the County Commission races was less than 10 percent, while the under vote in the Legislative races was more than 20 percent.
I can think of at least four possible explanations for this:
- Voters knew less about the State offices and candidates than the local ones, and didn’t want to make an uninformed vote;
- Voters were more motivated to vote in the County races, where there were both Republicans and Democrats on the ballot, than in the State races, where there were only Republicans;
- Voters didn’t vote in the State races since, with only a Republican and a “Write In” to choose from, the outcome was virtually predetermined;
- Voters knowingly or unknowingly cast an invalid vote, e.g. by writing in a name other than that of the “ghost” write-ins who qualified or filling in the “Write In” oval but leaving the line for the candidate’s name blank.
The last is what I did to protest the “write-in loophole” that had closed the Republican primaries for those races.
Moving further down the ballot, the percent of under votes continued to increase. Between 26 and 28 percent of voters didn’t vote in the Fire District races, a third didn’t vote in the Mosquito Control District races, and 35 percent didn’t vote in the Soil and Water Conservation Board race.
The strong voter turnout did NOT carry to the down-ballot races.
What’s next?
Maybe that’s just how it’s always been, and maybe that’s how it is everywhere. But is that acceptable? Shouldn’t some voter education group try to do something about it?
The Naples Daily News, the League of Women Voters and others hosted Candidate Forums and made them widely available, but the questions asked of the candidates assumed a certain basic level of understanding of the issues that I suspect many voters don’t have. Many of those for whom English is a second language would surely have had trouble following the debate.
Perhaps the under vote figures could be examined by precinct to learn how pervasive the problem is and try to identify the reason(s) for it. Once that is known, more and different forms of voter outreach and education can be explored and planned. I’d be interested in readers’ thoughts and suggestions.
In any case, I am closing my book on the 2016 elections for purposes of this blog. I’m looking forward to continuing to learn and write about the Collier County School District and public education in Florida, as well as other aspects of Florida government in Sparker’s Soapbox going forward. I hope you’ll continue to follow me.
Help me reach more Collier County voters by sharing this post with your friends. You and they can subscribe to Sparker’s Soapbox by email at www.sparkers-soapbox.blogspot.com, “like” me on Facebook at www.facebook.com/sparkers.soapbox or follow me on Twitter @SparkersSoapbox.